Click the link “Audit Analysis” in the left navigation menu and the following screen will be displayed.
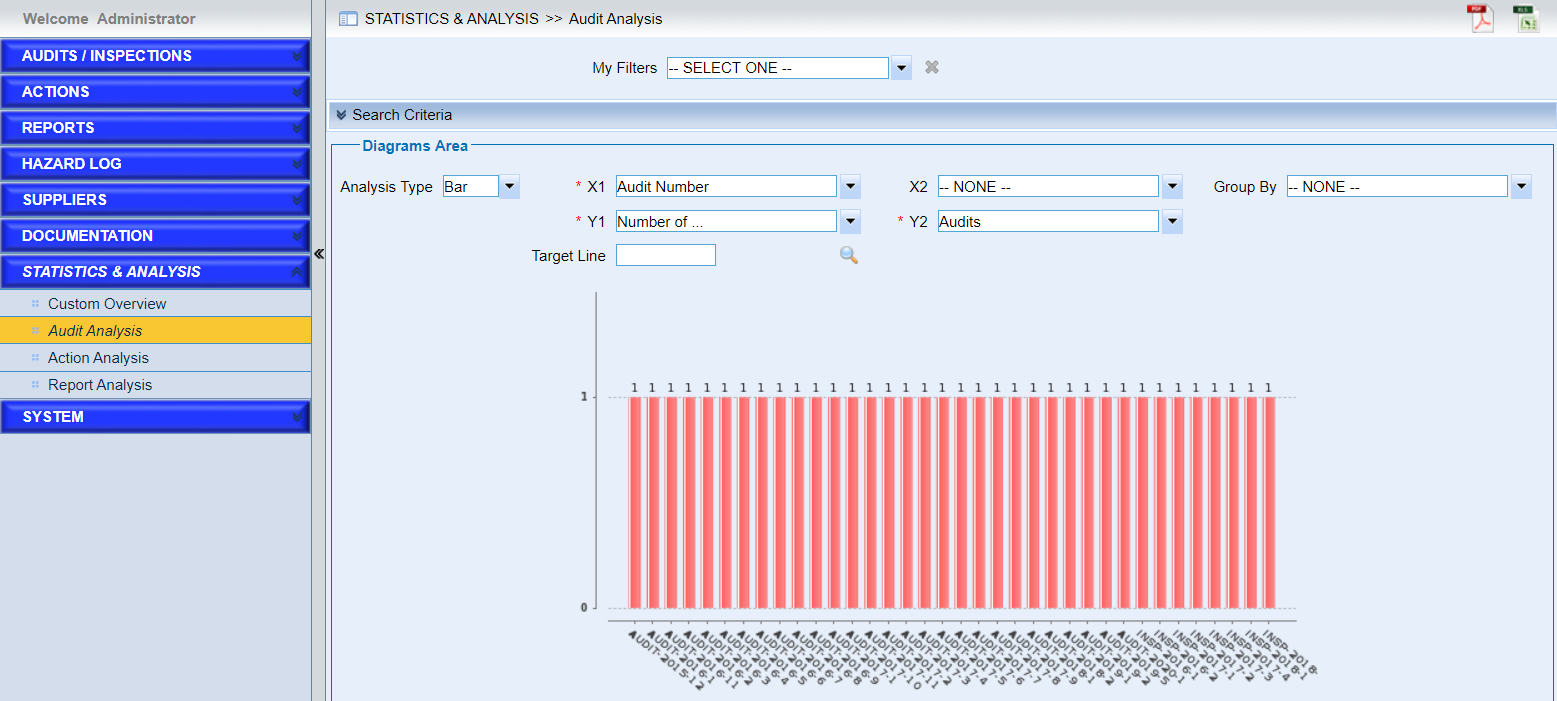
This page provides users to easily create charts and diagrams for visual representation of audit data with keywords or search criteria provided.
Users can do the following operations in this page.
•Choose the search criteria
•Choose the appropriate chart in ‘Analysis Type’
•Configure the options for the analysis type
➢Days to Closure
It means the date scope from the date when audit is conducted to the date when it’s closed.
➢Mean days to closure
The means days of the audits searched. It equals the value of total days to closure divide the number of searched closed audits.
➢Number of … Per … Units
This is used to analysis records in units. If these options are chosen for “Y1”, “Total No. of Units” should be specified.
•Click the ‘Search’ button or ![]() to search the results.
to search the results.
•Save the current charts or diagrams as filters.
Click the “Save As” button to save the current search criteria and configurations in “Diagram Area”.
The filters saved will be displayed in the dropdown list “My Filters” and facilitate the operations of users. Besides, users can customize the filters often used in page “Custom Overview”.
•Export diagram areas in PDF document by clicking icon ![]() .
.
•Export current audit statistics result in Excel document by clicking icon ![]() .
.